
")


")


Understanding Google Analytics:
Understanding Google Analytics data and reports is crucial for your business. This article will show the basics of using Google Analytics tool. Many business owners under utilize this amazing free tool. It’s essential for every business to regularly analyze performance of their content.
Using Google Analytics will help give you a detailed report of what’s working well in your business and the changes you might need to make.
Google Analytics Glossary:
Let’s discuss some of the Google Analytics terms before proceeding with the tutorial. This quick glossary will help you better understand Google Analytics.
- Dimensions: The dimensions are different descriptive attributes in the data report.
- Metrics: The metric pages or sessions are the average number of pages views per session.
- Sessions: A session is the amount of time a user is actively involved in your blog, website, application, etc.
- Users: Users calculates how many new visitors and returning visitors are attending your blog, website, or etc.
- Pageviews: Pageviews are the total numbers of page viewed in your blog or website.
- Pages/Sessions: The average numbers of pages viewed during a session measures the page/sessions.
- Avg. Session Duration: It measures the length of a session and it gives you an average session.
- Bounce Rate: The percentage of visitors to a particular website who navigate away from the site after viewing only one page.
- New Sessions: The percentage of first time visits it will give you a percentage.
- Goals: Gives you a report of users who have completed a specific goal you have set up for your blog or website.
- Conversions: Every time a goal is complete on your website or blog this counts as a conversion.
- Campaigns: Google analytics allows you to add campaigns to get more information from your referral traffic.
- Acquisition: It reflects where you get your users.
- Behavior: It let’s you to view behavior data to help you see which content is working and which one might need to be remove.
Why Google Analytics
Google analytics is a powerful free tool for monitoring and evaluating traffic on your website or blog. Google analytics will gather helpful data reports on what’s working on your site, track statistics, visitor engagement, and social media activity.
How do you plan to grow your business if you don’t understand what’s working? The free tool also helps you understand your audience and their needs. Using Google analytics will provide the following information:
- Who has visited your website?
- What are they doing when they are visiting your website?
- When they visit your site?
- Where did they arrive on your website from?
- How users interact with your site’s content?
Many people when they sign in to Google Analytics usually just look at their overall traffic for day. They measure the difference of traffic from the previous day and from the current day.
Google Analytics Tool
Get started with Google Analytics by visiting: Google.com/analytics.
To start gathering free information about your website or mobile app just follow the next steps:
- Create an account with Google Analytics at Google.com/analytics
- Sign into the account and follow the prompts.
- The account you have created, set up a property.
- It will as you to set up an account name, website name, website URL, choose industry category.
- Select get tracking ID
How To Install Google Analytics In WordPress
The easiest way to add Google Analytics is using their plugin.
- Download Google Analytics Plugin
- Open Google Analytics Plugin
- Paste the tracking ID
Google Analytics Tutorial
Google Analytics Home
After you log into Google Analytics, you will end up in the home page. The main page shows you a list of all the websites, blogs, or applications you have registered with Google Analytics. The right side of each property you will see basic data such as sessions, average session duration, bounce rate, goal conversion rate.

Google Analytics Reporting
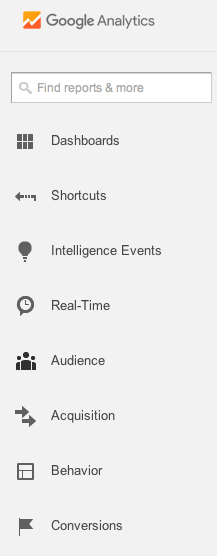
Click on the particular website you want to find more information about. At the top of the screen you’ll find different tabs such as home, reporting, customization, and admin. On the left side, you’ll see the dashboard that contains a search box that helps to find any specific reports and a list of different areas you can find different information on your site.
There are 7 categories I will be discussing today dashboard, shortcuts, intelligence events, real-time, audience, acquisition, and behavior.
Dashboard
Dashboard allows you to have a quick overview of your Google Analytics without having to go through each of the categories.
Shortcuts
The shortcuts categories allow you to customized links to your preferred Google Analytics reports. Any piece of data you want to revisit in the near future just click on the shortcut link above it to place it in the menu for quicker access.
Intelligence Events
Did you know you could set up alerts for Google Analytics to email you when a specific event occurs? If any of your metrics have a significant change in sessions, goal, or other metrics.
Real Time
Real time data let’s you know who’s on your website right now. The information provided is live and instantly.
Goal Conversions
The goal conversions give you in-depth information about users, traffic sources, content, and any goal completion.
I personally print this out once a month to have a comparison month after month on my blog. It’s essential to understand your audience and traffic so you can make any necessary changes to improve your blog.
I hope this post has given you a better understanding Google Analytics. It’s a free powerful tool that is under utilized. Make sure to start using it and getting familiarize with it. Make sure to join my newsletter to receive one delightful email per week about online marketing tips.
")

")
")

")

Thank you for putting this together Nancy! This is a great guide for anyone who is having a hard time becoming familiar with Google Analytics.
I for one have a better understanding of Google Analytics after reading this. Have a great day and weekend.
Cori
Hi Corina,
I am glad the post was helpful in understanding Google Analytics. Thank you for your support and leaving a thoughtful comment.
Hey Nancy, gotta say that the layout of your content is really good. (and also nice writing)
Regards!
Hi Peterson,
Thank you so much for stopping by my website. I appreciate your feedback!
Interesting I should find this article because I was just over looking at my analytics and what do I see? Somehow your site is my #5 top referrer; of all things! I have no idea how that’s happening unless you said something nice about me somewhere here that I never found out about but I appreciate the help. lol
Overall though, looking at my analytics is pretty depressing. It’s highlighting the nasty decline of visitors over the past two years once the Google animals went on the attack. However, I’m not going to spend too much time fretting about it; instead I’m going to push on.
Hi Mitch,
Thank you so much for the support and comment. Blogging takes a lot of time and dedication. Keep pushing on, always stay on top with the constant changes Google makes, and if you need help or have questions feel free to reach out to me.
It’s really a nice article to get the idea of goggle analytics at first hit .. I really appreciate your free will to spread the information .. Good Job Nancy !!
Hello Ayesha,
Thank you for your kind words! I am glad you enjoyed the post.
Hi Nancy. Greetings from India from a veteran brick and mortar professional of several decades!! My courtship with IT is less than three years. Presently, I am trying to help young entrepreneurs on how to strategize their business and also on maintaining a positive attitude. Your article seems to have been written precisely for dummies like me!! Thank you so much. I am constantly learning and your article added value to me.
Great Guide Thank You